Oops! Something went wrong with the browser.
Please try again. If the issue persists, contact support@logicimtech.com and include error code .
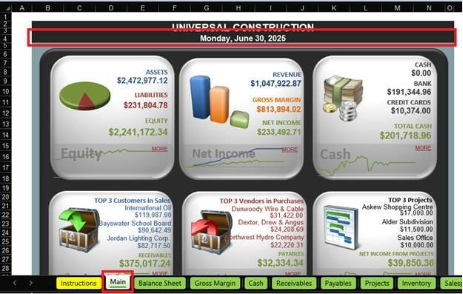
Logicim’s ready-to-use Sage 50 CA dashboard
Dashboard
This provides you with multiple beneficial Reports.
Prerequisite
- Logicim XLGL version 5.0 or higher
- Microsoft Excel 2016 or higher
- Sage 50 Canadian Edition (2014 and above)
What the Report does
This Dashboard Report generates visualizations and data for multiple Reports, including Balance sheet, Time & billing, Gross margin and more.
How to use the Report
- Enter the date on B4 of the Main worksheet.
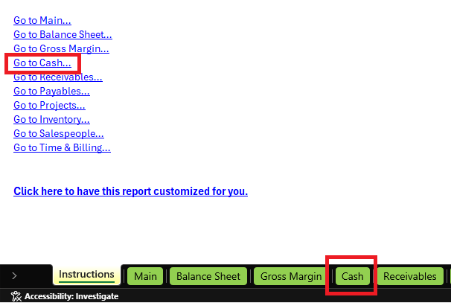
- After setting the date, values change automatically. Select a Report for more detailed viewing by clicking on its image or the worksheet name. For example, Cash.
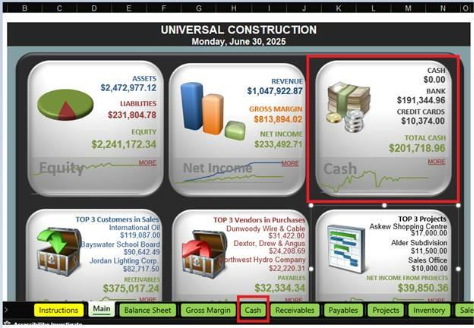
- You can also do this on the Instructions worksheet.
Common use cases
The Report offers good insight into the company, featuring several beneficial Reports summarized on the Main worksheet. The Report's format allows for direct presentation to stakeholders.
Troubleshooting
- Issue A: No values appear on the worksheet.
- Solution A: Ensure that your account has the necessary permissions to access the Accounts & General ledger.
FAQs
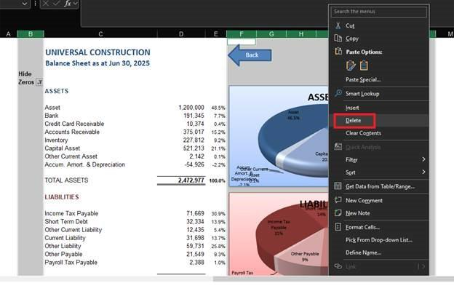
- Q: Can I add descriptions and delete the charts from a Report?
- A: Yes, you can! The Report works like a normal Excel worksheet. For example, if you want to create the Balance sheet worksheet ready to be printed, highlight the columns or rows that you don’t want to be seen on the print and do a right-click then select Delete.
Best practices
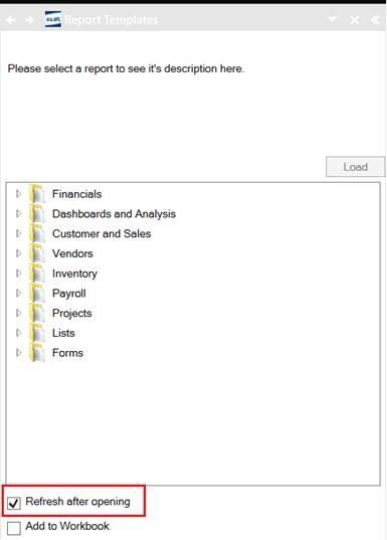
Connect to the correct company before loading this Report. Ensure that the Refresh after opening checkbox is checked. This allows the accurate company data and reduces steps such as clicking the Refresh button on the Logicim XLGL ribbon.
Related articles
No related articles found
Edited: Wednesday, July 30, 2025
Was this article helpful?
Thank you! Your feedback matters.
We'd love to hear your thoughts! Please provide a comment before submitting.