Oops! Something went wrong with the browser.
Please try again. If the issue persists, contact support@logicimtech.com and include error code .
Logicim's ready-to-use Sage 50 ratios
Ratios
This Report provides key ratios and financial data for your Reporting.
Prerequisite
- Logicim XLGL version 5.0 or higher
- Microsoft Excel 2016 or higher
- Sage 50 Canadian Edition (2014 and above)
What the Report does
The Ratios Report generates ratios for your Reporting, including average daily sales, liquidity ratios, and other vital metrics.
How to use the Report
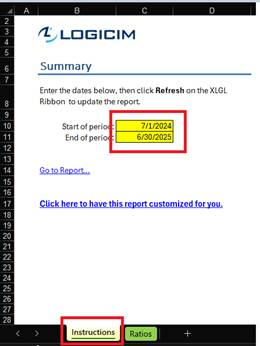
- Enter the Start of Period on cell C10 and End of Period on cell C11 on the Instructions worksheet.
Common use cases
This Report provides a clear overview of ratios for analyzing a company’s financial health. It serves as a concise cash flow Report, presenting numbers in a summary view.
Troubleshooting
- Issue: No values appear on the worksheet.
- Solution 1: Ensure the correct From and To date.
- Solution 2: Ensure your account has the necessary permissions to access the Accounts & General Ledger.
FAQs
- Q: May I just see the headers that I need?
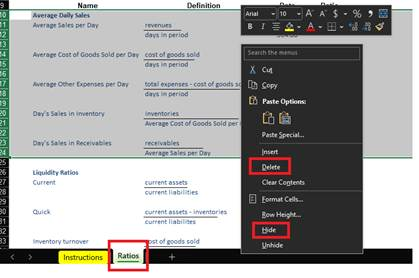
- A.1: Yes! You may do this by either hiding/deleting the rows containing the data that you don’t want to see.
Choose the rows that contain the data and do a right-click; afterward, choose Delete or Hide on the Ratios worksheet.
- A.2: Yes! You may do this by grouping the rows containing the data you don’t want to see.
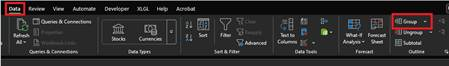
Once you have highlighted the rows, go to Data > Outline > Group.
Best practices
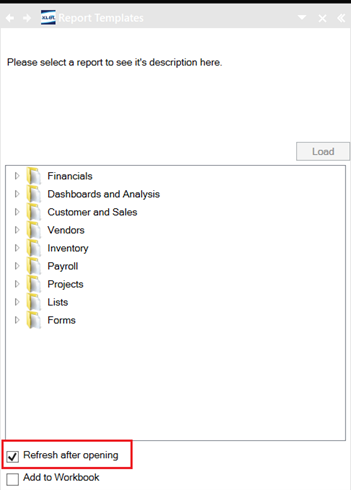
Ensure the Refresh after opening checkbox is checked. This enables the Report accurate company-wise and saves you some steps like clicking the Refresh button on the XLGL ribbon.
Related articles
No related articles found
Edited: Wednesday, June 25, 2025
Was this article helpful?
Thank you! Your feedback matters.