Oops! Something went wrong with the browser.
Please try again. If the issue persists, contact support@logicimtech.com and include error code .
Logicim’s ready-to-use Sage 50 CA financial statements side-by-side
Financial statements side-by-side
This Report displays the income statement and balance sheet side-by-side.
Prerequisite
- Logicim XLGL version 5.0 or higher
- Microsoft Excel 2016 or higher
- Sage 50 Canadian Edition (2014 and above)
What the Report does
The Financial statements side-by-side Report has two sections: the Income statement and Balance sheet. Worksheets are formatted in a way that is easier to understand due to the important elements presented side by side. For instance, the Balance sheet worksheet positions Liabilities next to Assets, which are typically found below them. There are 2 Reports in this file which are Balance sheet and Income statement.
How to use the Report
- Enter the Start of period and End of period dates for the Income Statement worksheet in cells C9 and C10.
- Enter the As of Date for the Balance sheet worksheet in cell C13.
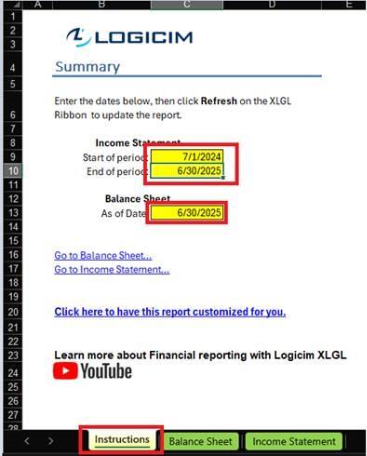
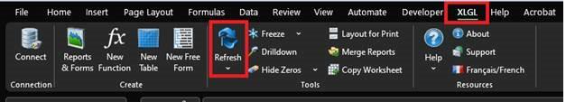
- After setting these, click Refresh on the Logicim XLGL ribbon.
Common use cases
The file contains two beneficial Reports: Balance sheet and Income statement. Their structure assists in analyzing your company’s financial health quickly, as key financial elements appear side-by-side. This also allows for easy comparison across accounts.
Troubleshooting
- Issue A: No values appear on the worksheet.
- Solution A.1: Ensure that your account has necessary permissions to access the Accounts & General ledger
- Solution A.2: (For Income statement) Please ensure that the Start of period date does not exceed the End of period date.
- Issue B: Wrong values appear on the worksheet.
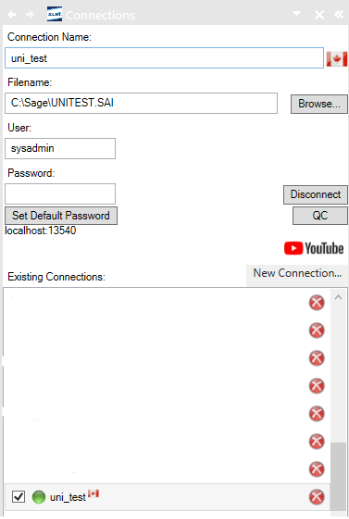
- Solution B: Ensure that you are connected to the right company.
For this example, the sample data provided by Sage 50 Canada was used.
FAQs
- Q: Can I only see the parts that I would want to see on the Reports?
- A: Yes, you can! The Reports work like a normal Excel worksheet and you are able to hide or delete the columns that you don’t want to see. Pro tip: it is better to hide the columns instead of deleting those as you might not know if you would need them in the future.
- Q: Can the Reports be customized to show comparative Reports within certain date ranges? Like years, quarters, or months?
- A: Yes, a custom period can be implemented through here: Custom Reporting
Best practices
Connect to the right company before loading this Report. Ensure that the Refresh after opening checkbox is checked. This enables the Report accurate company-wise and saves you some steps such as clicking the Refresh button on the Logicim XLGL ribbon.
Related articles
No related articles found
Edited: Wednesday, July 30, 2025
Was this article helpful?
Thank you! Your feedback matters.