

Oops! Something went wrong with the browser.
Please try again. If the issue persists, contact support@logicimtech.com and include error code .
Logicim's Ready-to-Use Sage 50 US Aged Receivable
Introduction
The Aged Receivable is a financial Report that shows all unpaid customer invoices grouped by how long they have been outstanding (e.g., 30 days, 60 days, 90+ days). It helps businesses track overdue payments and manage cash flow by identifying which customers still owe money and for how long.
Prerequisites
What the Report does
This Report provides a detailed breakdown of customer receivables, showing transaction-level and summary information such as customer details, invoice numbers, transaction dates, invoice amounts, payments, and aging buckets (0–30, 31–60, 61–90, and over 90 days), along with the total amount due. It also includes key summaries such as the Receivables Breakdown by Aging Period, Monthly Receivables Trend, and Receivables by Customer to help users monitor overdue balances, track collection performance, and analyze receivables trends over time.
How to use the Report
Step 1: Open the Report workbook.
Step 2: Go to the Instructions sheet.
Step 3: Enter the starting and end dates in C8. Then, in C9 , select which aged invoices by (Invoice Date or Due Date)

Step 4: Click the Refresh button from the Logicim XLGL tab to update the Report.
Step 5: Review the Report:
- Aging summary: Breaks down receivables into categories (0-30, 31-60, 61-90, and Over 90 Days).
- Customer-level details: View outstanding amounts by customer.
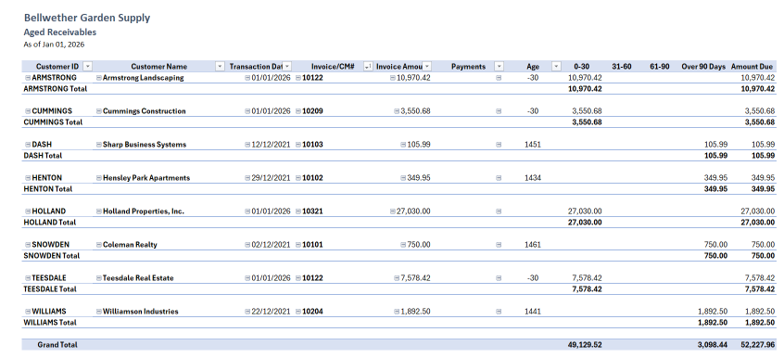
- Charts for Insights: Analyze trends and outstanding receivables visually.
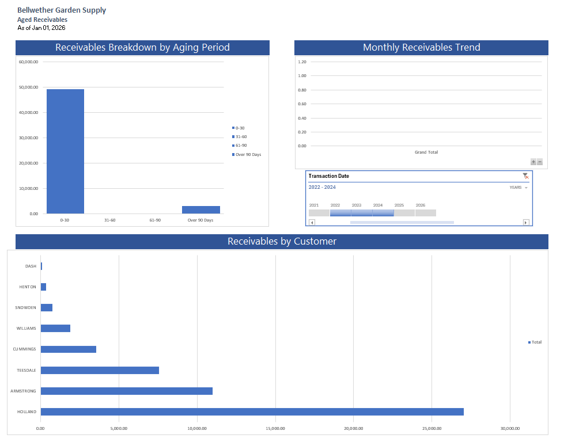
Customization options
- Adjust the desired year in the Parameters sheet to generate data for a different period.
- You may customize the Pivot Table by selecting PivotChart Analyse > Field List.
- Add conditional formatting to highlight overdue invoices.
Common use cases
- Monitor overdue customer payments by aging period to support collections
- Track monthly receivables trends to analyze cash flow
- Identify high-balance customers for follow-up and credit management
Troubleshooting
Issue: The Report doesn’t update after changing parameters in the Instructions sheet.
Solution: Ensure you are connected to your Sage data > Connect tab and have clicked the Refresh button.
Issue: No data is populated.
Solution: Verify that the input parameters are correct and that the selected date range contains existing records.
FAQs
Q: Can I add more customers to the Top 10 chart?
A: Yes! You can adjust the chart settings to include more or fewer customers.
Q: How can I filter the Report?
A: Click the arrow on any column to access the pivot table filtering option.
Best practices
- Use filters to focus on specific customers or aging periods. Ensure you are connected to your data source. Save a backup before creating significant adjustments to the Report structure.
- Save a backup copy of the Report before making significant changes.
- Regularly review the Report to track progress and identify trends early.
- Customize the Report to focus on key performance indicators relevant to your business.
Supporting Articles
References
Related articles
Edited: Thursday, August 27, 2026
Was this article helpful?
Thank you! Your feedback matters.