

Oops! Something went wrong with the browser.
Please try again. If the issue persists, contact support@logicimtech.com and include error code .
Logicim's ready-to-use Sage 50 US Item Sold to Customers
Item Sold to Customers
Item Sold to Customers shows items sold to customers in Sage 50 US for a selected date range. Use the Report to review customer-level item activity, invoice details, sales amounts, cost of sales, gross profit, gross margin, and top item trends.
Prerequisites
- Microsoft Windows 10 Pro, Windows 11 Pro, or Windows Terminal Server (2012 and above)
- Microsoft Office 365
- Sage 50 US edition (2021 and above)
- Internet connection
What the Report Does
Item Sold to Customers is an Accounts Receivable Report that displays item sales grouped by customer. The Report worksheet shows the connected company name, selected reporting period, customer totals, and customer-type totals.
Visible columns include Customer ID, Description, Customer Type, Date, Invoice Number, Item ID, Quantity, Amount, Cost of Sales, Gross Profit, and Gross Margin. The Chart worksheet summarizes the top 20 item IDs by sales revenue and sales volume.
How to Use the Report
Step 1: Enter the start date in C8 and the end date in C9 on the Instructions worksheet.
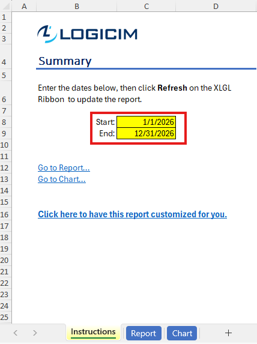
Step 2: Click Refresh on the XLGL ribbon to update the Report.

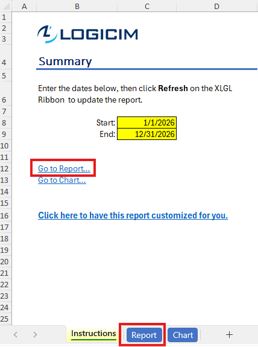
Step 3: Click Go to Report... or select the Report worksheet to review customer, invoice, and item activity for the selected period.
Step 4: Use the available field buttons to filter the results by customer, customer type, date, invoice number, or item ID.

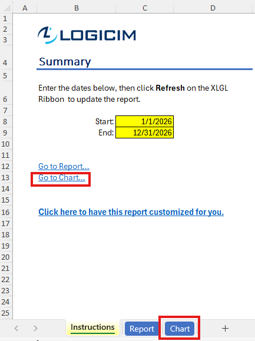
Step 5: Click Go to Chart... or select the Chart worksheet to review the top 20 item IDs by sales revenue and sales volume.
Customization Options
- Change the date range in C8 and C9 on the Instructions worksheet, then refresh the Report.
- Use the field buttons on the Report worksheet to filter the visible customer, invoice, and item details.
- Keep the hidden Data and ChartData worksheets unchanged to preserve the default Ready-to-Use Report structure.
- Request a customized version when you need additional fields, different groupings, or revised chart rankings by using this link.
Common Use Cases
- Review which customers purchased specific item IDs during a selected period.
- Compare sales amounts, quantities, cost of sales, gross profit, and gross margin by customer.
- Review customer and customer-type totals for Accounts Receivable sales analysis.
- Identify the top item IDs by sales revenue and sales volume.
Troubleshooting
Issue: The Report shows an unexpected reporting period.
Solution: Confirm the start date in C8 and the end date in C9 on the Instructions worksheet, then click Refresh on the XLGL ribbon.
Issue: The Report appears blank or outdated.
Solution: Confirm that Logicim XLGL is connected to the correct Sage 50 US company, then refresh the Report.
Issue: The charts do not reflect the latest selected period.
Solution: Refresh the Report after changing the dates, then review the Chart worksheet again.
Issue: Required columns, groupings, or charts are not included.
Solution: Request a customized version and specify the required fields, groupings, charts, or sample layout.
FAQs
Q: Can I change the reporting period?
A: Yes. Enter the start date in C8 and the end date in C9 on the Instructions worksheet, then refresh the Report.
Q: Which columns are available on the Report?
A: The Report worksheet displays Customer ID, Description, Customer Type, Date, Invoice Number, Item ID, Quantity, Amount, Cost of Sales, Gross Profit, and Gross Margin.
Q: Does the Report include charts?
A: Yes. The Chart worksheet displays the top 20 item IDs by sales revenue and sales volume.
Q: Can I add fields or change the chart layout?
A: Request a customized version when you need a different Report structure. This helps preserve the formulas and hidden support worksheets in the Ready-to-Use Report.
Best Practices
- Confirm that Logicim XLGL is connected to the correct Sage 50 US company before refreshing the Report.
- Verify the dates in C8 and C9 before using customer or item totals for analysis.
- Use the filters to isolate a customer, invoice, or item ID, then clear the filters before performing a broader review.
- Review the Report worksheet before the Chart worksheet so that top item trends can be traced to the supporting customer and invoice details.
- Save a separate copy before making structural changes to the workbook.
References
Logicim Ready-to-Use Sage 50 US Report - Item Sold to Customers (YouTube)
Related articles
Edited: Thursday, September 24, 2026
Was this article helpful?
Thank you! Your feedback matters.