

Oops! Something went wrong with the browser.
Please try again. If the issue persists, contact support@logicimtech.com and include error code .
Logicim's Ready-to-Use Sage 50 US Customer Sales History
Customer Sales History
Customer Sales History is an Accounts Receivable Ready-to-Use Report for Sage 50 US. It shows customer sales, cost of sales, gross profit, and gross margin for the selected period so you can review customer profitability in Excel.
Prerequisites
What the Report Does
The Report worksheet summarizes customer sales history by Customer ID and customer description. It displays Amount, Cost of Sales, Gross Profit, and Gross Margin, with a Grand Total row for the selected period. The hidden Data worksheet includes sales transaction fields such as invoice number, date, customer ID, salesperson ID, sales tax code, due date, ship-to information, quantity, price, and calculated cost values. The Chart worksheet provides a visual Gross Margin Analysis by Customer and includes a Sales Performance by Customer chart area.
How to Use the Report
Step 1: Enter or confirm the Start date in C8 and the End date in C9 on the Instructions worksheet.
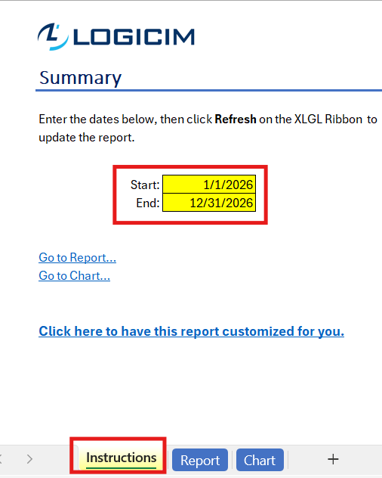
Step 2: click Refresh on the XLGL ribbon to update the Report.

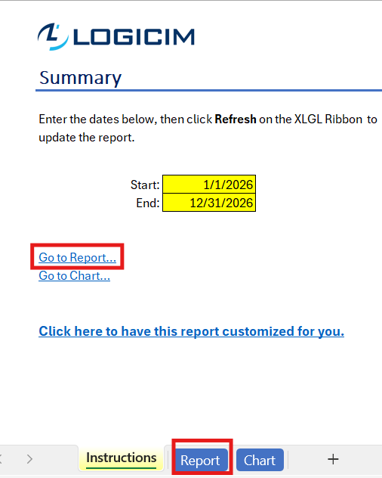
Step 3: Click Go to Report... on the Instructions worksheet, or select the Report worksheet, to review customer sales, cost of sales, gross profit, and gross margin for the selected period.
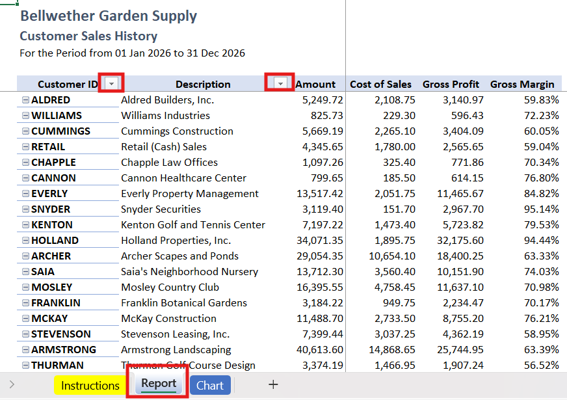
Step 4: Use the filter buttons in the Report worksheet headers to focus on selected customer IDs or customer descriptions when you need a narrower review.
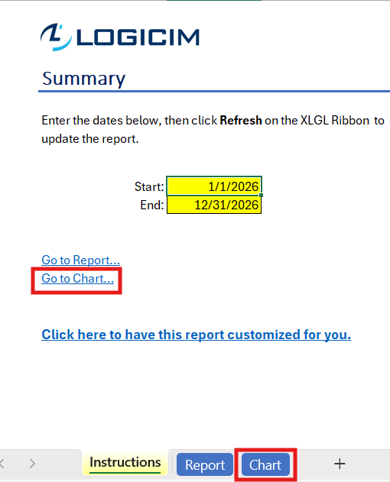
Step 5: Click Go to Chart... on the Instructions worksheet, or select the Chart worksheet, to review the gross margin chart for the same customer sales history data.
Customization Options
You can change the reporting period by updating C8 and C9 on the Instructions worksheet and refreshing the Report. You can also use the visible Excel filter buttons on the Report worksheet to narrow the customer list, and you can apply normal Excel formatting to the visible Report and Chart worksheets. Keep the hidden Data and ChartData worksheets unchanged unless you are making a controlled customization. The Instructions worksheet includes a link to request customization from Logicim.
Common Use Cases
- Review customer profitability by comparing Amount, Cost of Sales, Gross Profit, and Gross Margin across customers.
- Identify customers with high sales amounts but lower gross margin percentages for follow-up review.
- Compare customer sales performance for a month, quarter, year, or another selected period.
- Use the Chart worksheet to present gross margin analysis by customer in a visual format.
- Check the Grand Total row before sharing period sales and margin results.
Troubleshooting
- If the period is not correct, confirm the Start date in C8 and the End date in C9 on the Instructions worksheet, then click Refresh again.
- If expected customers are missing, check the selected date range and remove any active filters on the Report worksheet before reviewing the results.
- If values appear stale, confirm that Excel is connected to the correct Sage 50 US company data and click Refresh on the XLGL ribbon.
- If the Chart worksheet does not match the Report worksheet, refresh the Report after updating the dates, then review the Chart worksheet again.
- If the issue continues, send the workbook, screenshots, and the steps you followed to Logicim support.
FAQs
Q: What period does Customer Sales History use?
A: The period comes from the Start date in C8 and the End date in C9 on the Instructions worksheet.
Q: What values are shown on the Report worksheet?
A: The worksheet shows Amount, Cost of Sales, Gross Profit, and Gross Margin by customer, plus a Grand Total row.
Q: Can I filter the customer list?
A: Yes. Use the visible filter buttons in the Report worksheet headers to focus on specific customer IDs or descriptions.
Q: Does the workbook include charts?
A: Yes. The Chart worksheet includes Gross Margin Analysis by Customer and a Sales Performance by Customer chart area.
Q: Can this Ready-to-Use Report be customized?
A: Yes. Use the customization link on the Instructions worksheet or contact Logicim with the changes you need.
Best Practices
- Review the company name and period label at the top of the Report worksheet before using the results.
- Refresh the Report after changing C8 or C9 on the Instructions worksheet.
- Check the Grand Total row and a few customer rows before distributing the workbook.
- Use filters for review, then clear filters before saving a shared copy when others need the full customer list.
- Keep the hidden Data and ChartData worksheets unchanged unless Logicim or an authorized Report designer is customizing the workbook.
References
Related articles
Edited: Thursday, September 24, 2026
Was this article helpful?
Thank you! Your feedback matters.