

Oops! Something went wrong with the browser.
Please try again. If the issue persists, contact support@logicimtech.com and include error code .
Logicim's ready-to-use Sage 50 US Inventory Profitability
Inventory Profitability
The Inventory Profitability Report provides detailed inventory performance and profitability analysis. Assess item-level sales, costs, units sold, gross profit, and gross margins.
Prerequisites
- Microsoft Windows 10 Pro, Windows 11 Pro, or Windows Terminal Server (2012 and above)
- Microsoft Office 365
- Sage 50 US edition (2021 and above)
- Internet connection
What the Report Does
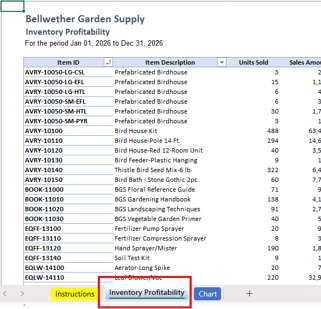
The Inventory Profitability Report displays detailed inventory transactions and financial performance metrics in one organized view. Review Sales Amount, Cost of Sales, Gross Profit, Units Sold, and Gross Margin % for each inventory item.
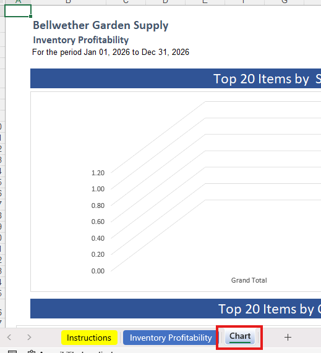
The Chart worksheet displays the Top 20 Items by Sales Amount and by Cost of Sales, providing a visual overview of inventory performance.
How to Use the Report
Step 1: Enter the Start Date and End Date in cells C8 and C9 on the Instructions worksheet.
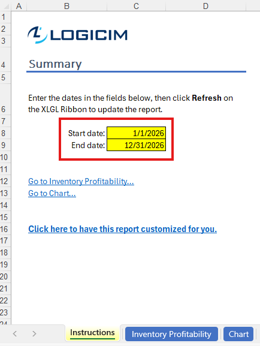
Step 2: Click Refresh on the XLGL ribbon.

Step 3: Review the results on the following worksheets:
- Report – Review item-level sales, costs, units sold, gross profit, and gross margin.
- Chart – Review the highest-performing items based on sales amount and cost of sales.
Customization Options
Use the filter arrows on the Report worksheet to display specific Item IDs, Item Descriptions, or Item Classes. You can also sort columns such as Units Sold, Sales Amount, Cost of Sales, and Gross Profit using standard Microsoft Excel features.
For additional fields, calculations, layouts, or other changes, use the customization option on the Instructions worksheet or refer to the customization link in the References section.
Common Use Cases
- Compare gross profit and cost of sales for individual inventory items.
- Identify items that generate the highest sales and gross profit.
- Review gross margin percentages before adjusting selling prices.
- Compare inventory performance across item classes and categories.
- Monitor changes in item profitability over a selected period.
Troubleshooting
Issue: Zero values appear on the Report worksheet.
Solution: Verify that the End Date is later than the Start Date, confirm that the selected period contains inventory sales, and click Refresh on the XLGL ribbon.
FAQs
Q: Why does the Report appear blank after applying or changing a filter?
A: Click Refresh on the XLGL ribbon to reload the Report data, and verify that the applied filters include available inventory transactions.
Best Practices
- Save a backup copy of the Report before making significant changes.
- Review the Report regularly to identify changes in item profitability and gross margins.
- Use a consistent date range when comparing results between periods.
- Use filters to focus on the inventory items, descriptions, or classes most relevant to your analysis.
Video
Related articles
Edited: Wednesday, September 30, 2026
Was this article helpful?
Thank you! Your feedback matters.