

Oops! Something went wrong with the browser.
Please try again. If the issue persists, contact support@logicimtech.com and include error code .
Logicim's ready-to-use Sage 50 US Job Ledger
Job Ledger
The Job Ledger Report provides a detailed financial breakdown of specific jobs or projects through a designated end date. Use the Report to evaluate project profitability and compare revenue with labor, material, equipment, and other project costs.
Prerequisites
- Microsoft Windows 10 Pro, Windows 11 Pro, or Windows Terminal Server (2012 and above)
- Microsoft Office 365
- Sage 50 US edition (2021 and above)
- Internet connection
What the Report Does
The Job Ledger Report evaluates project-specific revenue, expenses, labor costs, and account balances.
- Review project costs organized by Job Description, Phase ID, and Cost Code ID.
- Compare Debit, Credit, and Net DR/CR balances for specific jobs and phases.
- Review the Financial Overview by Job and Transaction Trends by Job charts to assess project activity.
How to Use the Report
Step 1: Enter the end date in C8 on the Instructions worksheet.
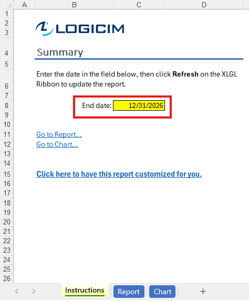
Step 2: Click Refresh on the XLGL ribbon to update the Report.

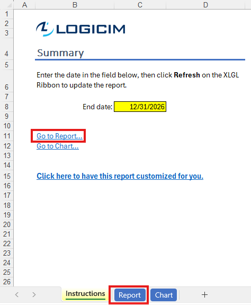
Step 3: Review the project transactions and balances on the Report worksheet.
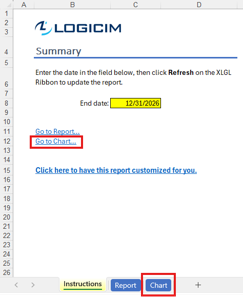
Step 4: Review the financial overview and transaction trends on the Chart worksheet.
Customization Options
- Use the drop-down arrows on the Report worksheet to filter by Job Description, Phase ID, Cost Code ID, or other visible fields.
- Use the filters beside the Report to focus on specific project information.
- Change the end date in C8, then refresh the Report to review project activity through another date.
- Request a customized version through the customization link on the Instructions worksheet or by using this link.
Common Use Cases
- Evaluate project profitability by comparing revenue with total project costs.
- Track labor, material, equipment, and other expenses across project phases.
- Review debit, credit, and net balances by job, phase, or cost code.
- Identify changes in project financial activity through the built-in charts.
Troubleshooting
Issue: Zero values appear on the worksheet.
Solution: Confirm that your Sage 50 US account has permission to access the Accounts and General Ledger information required by the Report.
Issue: The Report does not display the expected project activity.
Solution: Verify that the end date in C8 falls within an active fiscal year and includes the transactions you want to review, then refresh the Report.
Issue: The Report appears blank after applying filters.
Solution: Review or clear the active filters, then click Refresh on the XLGL ribbon.
Issue: The charts do not reflect the latest end date.
Solution: Refresh the Report after changing the date in C8, then review the Chart worksheet again.
FAQs
Q: Can I display only specific project phases?
A: Yes. Use the drop-down arrows or the filters beside the Report to isolate the required Phase IDs.
Q: Can I filter the Report by cost code?
A: Yes. Use the Cost Code ID filter to display transactions associated with selected cost codes.
Q: What date does the Report use?
A: The Report displays project activity through the end date entered in C8 on the Instructions worksheet.
Q: Does the Report include charts?
A: Yes. The Chart worksheet includes the Financial Overview by Job and Transaction Trends by Job views.
Best Practices
- Verify the end date in C8 before refreshing the Report.
- Review active filters before using Report balances for project analysis.
- Compare the Report worksheet details with the Chart worksheet summaries.
- Review project costs regularly to identify unexpected expenses or changes in profitability.
- Save a separate copy before making structural changes to the workbook.
References
Logicim Ready-to-Use Sage 50 US Report - Job Ledger (YouTube)
Related articles
Edited: Thursday, September 24, 2026
Was this article helpful?
Thank you! Your feedback matters.