

Oops! Something went wrong with the browser.
Please try again. If the issue persists, contact support@logicimtech.com and include error code .
Logicim's ready-to-use Sage 50 US Job Profitability
Job Profitability
The Job Profitability Report provides a detailed financial analysis of specific jobs and projects. Use the Report to compare project revenue with actual expenses, evaluate profit margins, and monitor financial performance.
Prerequisites
- Microsoft Windows 10 Pro, Windows 11 Pro, or Windows Terminal Server (2012 and above)
- Microsoft Office 365
- Sage 50 US edition (2021 and above)
- Internet connection
What the Report Does
The Job Profitability Report compares project revenue with actual expenses in an optimized view. Review account details, project completion percentages, and profit margins to assess each job's financial performance.
The Dashboard worksheet highlights top-performing jobs and supervisors, providing a summarized view of project financial health.
How to Use the Report
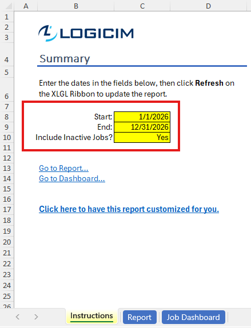
Step 1: Enter the start date in C8 and the end date in C9, and choose Yes on C10 if you want to include Inactive Jobs on the Instructions worksheet.
Step 2: Click Refresh on the XLGL ribbon to update the Report.

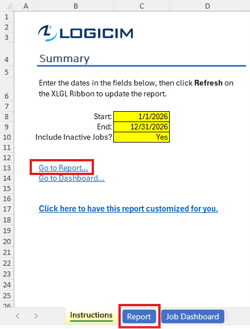
Step 3: Review the project revenue, expenses, completion percentages, and profit margins on the Report worksheet.
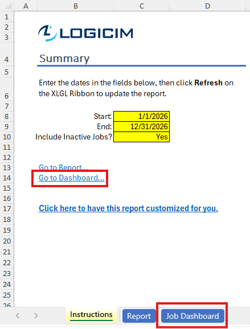
Step 4: Review the top-performing jobs and supervisors on the Dashboard worksheet.
Customization Options
- Use the drop-down arrows on the Report worksheet to filter by Job Description, Account Type, Journal, or other visible fields.
- Use the filters beside the Report to focus on specific jobs or financial information.
- Change the dates in C8 and C9, then refresh the Report to review another reporting period.
- Request a customized version through the customization link on the Instructions worksheet or by using this link.
Common Use Cases
- Compare actual project revenue with actual expenses.
- Evaluate profit margins and completion percentages for specific jobs.
- Identify top-performing jobs based on their financial results.
- Compare supervisor performance before project reviews or quarterly meetings.
Troubleshooting
Issue: Zero values appear on the worksheet.
Solution: Confirm that your Sage 50 US account has permission to access the Accounts and General Ledger information required by the Report.
Issue: The Report does not display the expected reporting period.
Solution: Verify that the end date in C9 is later than the start date in C8, then click Refresh on the XLGL ribbon.
Issue: The Report appears blank after applying filters.
Solution: Review or clear the active filters, then click Refresh on the XLGL ribbon.
Issue: The Dashboard does not reflect the latest reporting period.
Solution: Refresh the Report after changing the dates, then review the Dashboard worksheet again.
FAQs
Q: Can I filter the Report by job?
A: Yes. Use the Job Description drop-down arrow or the filters beside the Report to display specific jobs.
Q: Can I review specific account types or journals?
A: Yes. Use the Account Type or Journal filters to isolate the required financial information.
Q: What profitability information does the Report include?
A: The Report includes project revenue, actual expenses, completion percentages, and profit margins.
Q: What information appears on the Dashboard?
A: The Dashboard worksheet highlights top-performing jobs and supervisors.
Best Practices
- Verify the dates in C8 and C9 before refreshing the Report.
- Review active filters before using the Report results for profitability analysis.
- Review the detailed results on the Report worksheet before using the summarized information on the Dashboard worksheet.
- Review project revenue, expenses, and margins regularly to identify changes in financial performance.
- Save a separate copy before making structural changes to the workbook.
References
Logicim Ready-to-Use Sage 50 US Report - Job Profitability (YouTube)
Related articles
Edited: Friday, September 25, 2026
Was this article helpful?
Thank you! Your feedback matters.