

Oops! Something went wrong with the browser.
Please try again. If the issue persists, contact support@logicimtech.com and include error code .
Logicim's ready-to-use Sage 50 US Sales Order Journal
Sales Order Journal
Sales Order Journal is a Sage 50 US Ready-to-Use Report for reviewing sales order activity from Accounts Receivable. Use it to review order lines for a selected period and Sales Order Status, then compare the detailed Report worksheet with the summary views on the Chart worksheet.
Prerequisites
- Microsoft Windows 10 Pro, Windows 11 Pro, or Windows terminal server (2012 and above)
- Microsoft Office 365
- Sage 50 US edition (2021 and above)
- Internet connection
- Sales order activity in Sage 50 US for the date range and Sales Order Status selected on the Instructions worksheet.
What the Report Does
The Instructions worksheet lets you set a Start date in C9, an End date in C10, and a Sales Order Status in C11 before refreshing the Report. The Report worksheet shows Sales Order Journal details for the selected period. Visible columns include Date, SO/Proposal Number, Account ID, Account Description, Line Description, U/M ID, U/M Description, Status, Quantity, Debit Amount, Credit Amount, Unit Price, and Amount. The workbook also includes hidden source data fields such as Sales Order Number, Customer PO, Customer ID, Customer Name, Sales Tax Code, Date Due, and Ship To fields. The Chart worksheet provides summary views labelled Top 10 Customers by Quantity Sold and Sales Distribution by Account.
How to Use the Report
Step 1) Enter or confirm the Start date in C9 and the End date in C10 on the Instructions worksheet. Select the Sales Order Status in C11.
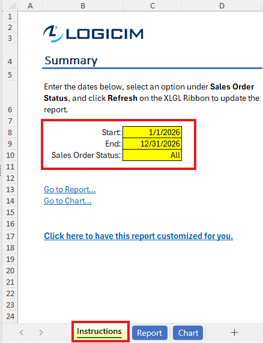
Step 2) Click Refresh on the XLGL ribbon to update the Report for the selected dates and status.

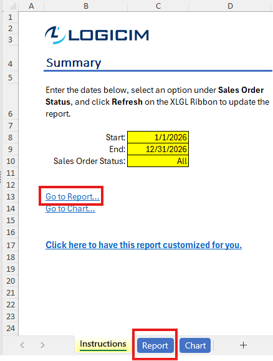
Step 3) Select Go to Report... or open the Report worksheet to review the sales order lines by date, SO/Proposal Number, account, status, quantity, debit amount, credit amount, unit price, and amount.
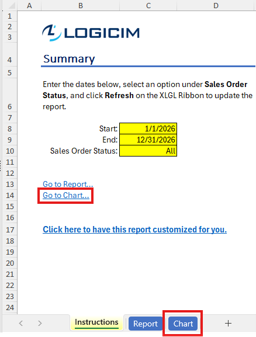
Step 4) Select Go to Chart... or open the Chart worksheet to review Top 10 Customers by Quantity Sold and Sales Distribution by Account.
Customization Options
Use the Start date, End date, and Sales Order Status fields on the Instructions worksheet to adjust the period and status scope before refreshing. You can also use normal Excel formatting for review copies. For structural changes, additional fields, or different calculations, use the customization link on the Instructions worksheet or request a Custom Report from Logicim.
Common Use Cases
- Review sales order activity for a selected accounting period.
- Compare open, closed, or all sales order lines by using the Sales Order Status input on the Instructions worksheet.
- Review quantities, debit amounts, credit amounts, unit prices, and total amounts by account and line description.
- Use the Chart worksheet to identify high-quantity customers and review sales distribution by account.
Troubleshooting
- If the Report does not reflect the selected period, confirm the Start date in C9 and End date in C10, then click Refresh on the XLGL ribbon.
- If the Report shows the wrong sales order scope, confirm the Sales Order Status in C11 before refreshing.
- If values appear stale, confirm that Excel is connected to the correct Sage 50 US company and refresh the Report again.
- If the Chart worksheet does not match your review period, refresh after confirming the Instructions worksheet inputs, then compare the chart period heading with the Report worksheet period heading.
FAQs
- Q: Can I change the date range? A: Yes. Use C9 for the Start date and C10 for the End date on the Instructions worksheet.
- Q: Can I review only open or closed sales orders? A: Use the Sales Order Status input in C11. The workbook default shown in the evidence is All, and the workbook formula recognizes Open and Close status options.
- Q: What detail columns are available on the Report worksheet? A: The visible columns include Date, SO/Proposal Number, Account ID, Account Description, Line Description, U/M ID, U/M Description, Status, Quantity, Debit Amount, Credit Amount, Unit Price, and Amount.
- Q: Does the workbook include charts? A: Yes. The Chart worksheet includes views labelled Top 10 Customers by Quantity Sold and Sales Distribution by Account.
Best Practices
- Confirm the date range and Sales Order Status before clicking Refresh.
- Check the company name and period heading at the top of the Report and Chart worksheets before using the results.
- Review the detailed Report worksheet before relying on the Chart worksheet summaries.
- Keep a backup copy before making structural Excel changes such as adding formulas, moving columns, or editing hidden worksheets.
Related articles
Edited: Monday, August 31, 2026
Was this article helpful?
Thank you! Your feedback matters.