

Oops! Something went wrong with the browser.
Please try again. If the issue persists, contact support@logicimtech.com and include error code .
Logicim's Ready-to-Use Sage 50 CA Customer Profitability Summary
Customer Profitability Summary
Introduction
Customer Profitability Summary is a Ready-to-Use Report for Sage 50 Canada that shows each customer's quantity sold, revenue, cost of goods sold, profit, and margin for the selected period.
Prerequisites
- Microsoft Windows 10 Pro, Windows 11 Pro, or Windows terminal server (2012 and above)
- Microsoft Office 365
- Sage 50 Canadian edition (2014 and above)
- Internet connection
What the Report Does
The Instructions worksheet uses C8 for the start of period and C9 for the end of period. The Report worksheet shows Customer Name, Quantity, Revenue, COGS, Profit, and Margin, and includes a Grand Total row. The Chart worksheet shows an Inventory and Services Sales Summary chart for revenue, COGS, and margin. The hidden Data worksheet includes source fields such as Customer_Name, Part_Number, Part_Name, Quantity_, Revenue_, COGS_, Date_, Profit, and margin-related formulas.
How to Use the Report
1. Enter the start date in cell C8 and the end date in cell C9 on the Instructions worksheet.
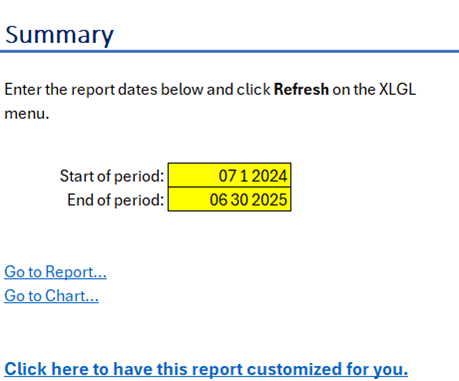
The **Instructions** worksheet contains the start and end date inputs.
2. Click Refresh on the XLGL menu to update the Report for the selected dates.
3. Click Go to Report... on the Instructions worksheet to review the Report worksheet.
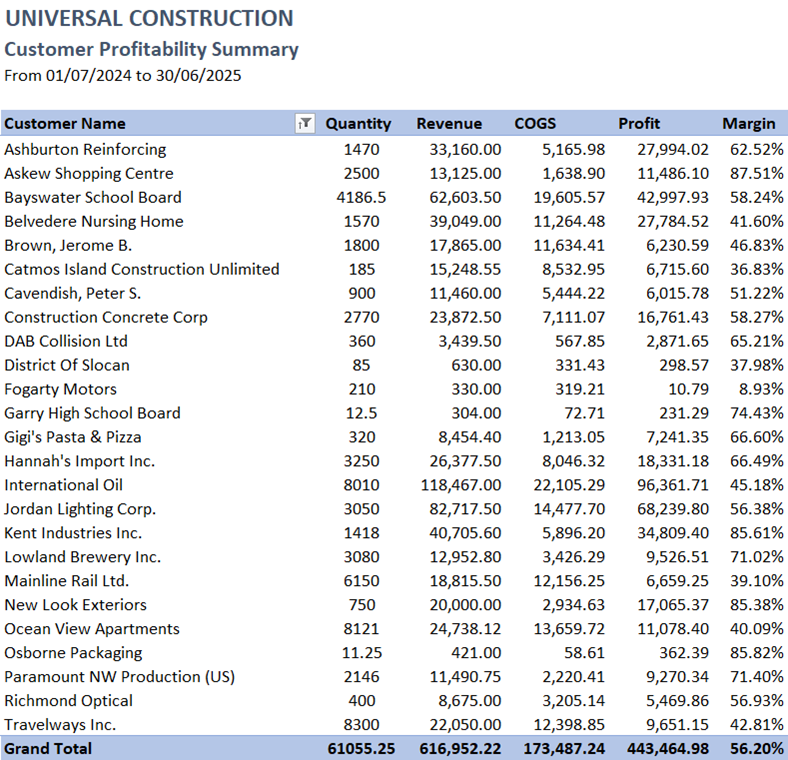
The **Report** worksheet lists customer profitability by quantity, revenue, COGS, profit, and margin.
4. Click Go to Chart... on the Instructions worksheet to review the Chart worksheet.
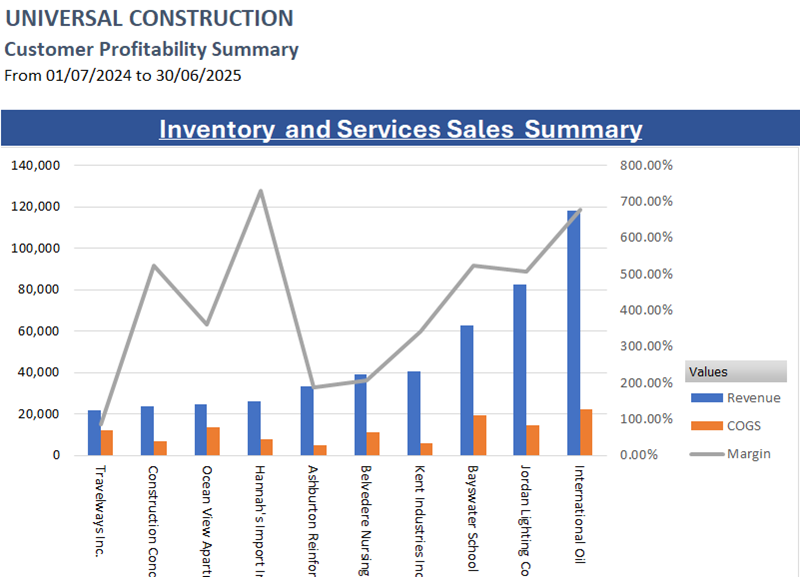
The **Chart** worksheet shows the Inventory and Services Sales Summary for the selected period.
Customization Options
You can change the reporting period by updating cell C8 and cell C9 on the Instructions worksheet. You can also use standard Excel formatting, sorting, and filtering on the visible Report output. For changes to the Report layout, calculations, hidden worksheets, or chart design, use the customization link shown on the Instructions worksheet.
Common Use Cases
- Compare customer revenue, COGS, profit, and margin for a selected date range.
- Identify customers with high revenue but lower margin for follow-up review.
- Review the Grand Total row and the Chart worksheet before discussing sales profitability.
- Use the customer-level summary to support period-end sales and margin analysis.
Troubleshooting
Issue: The Report shows the wrong period.
Solution: Check cell C8 and cell C9 on the Instructions worksheet, click Refresh on the XLGL menu, and confirm the date range shown on the Report worksheet.
Issue: The Chart worksheet does not reflect the expected customer profitability values.
Solution: Click Refresh after changing the date inputs, then open the chart again from Go to Chart... on the Instructions worksheet.
Issue: A customer or amount is not included in the review.
Solution: Confirm that the selected start and end dates cover the transactions you want to analyze, then refresh the Report.
FAQs
Q: Which date inputs control Customer Profitability Summary?
A: The Report uses cell C8 as the start of period and cell C9 as the end of period on the Instructions worksheet.
Q: Which columns appear on the Report worksheet?
A: The visible output includes Customer Name, Quantity, Revenue, COGS, Profit, and Margin.
Q: Does this Report include a chart?
A: Yes. The Chart worksheet shows the Inventory and Services Sales Summary with revenue, COGS, and margin.
Q: Where can I request changes to this Report?
A: The Instructions worksheet includes a customization link for requesting changes.
Best Practices
- Verify cell C8 and cell C9 before refreshing the Report.
- Review the Grand Total row after refreshing to confirm that the period summary is complete.
- Use the Report worksheet for customer-level detail and the Chart worksheet for a visual summary.
- Keep the hidden Data and PivotChartData worksheets unchanged unless the Report is being customized.
References
Related articles
Edited: Friday, September 25, 2026
Was this article helpful?
Thank you! Your feedback matters.